208
Individual Demand or Supply Curve
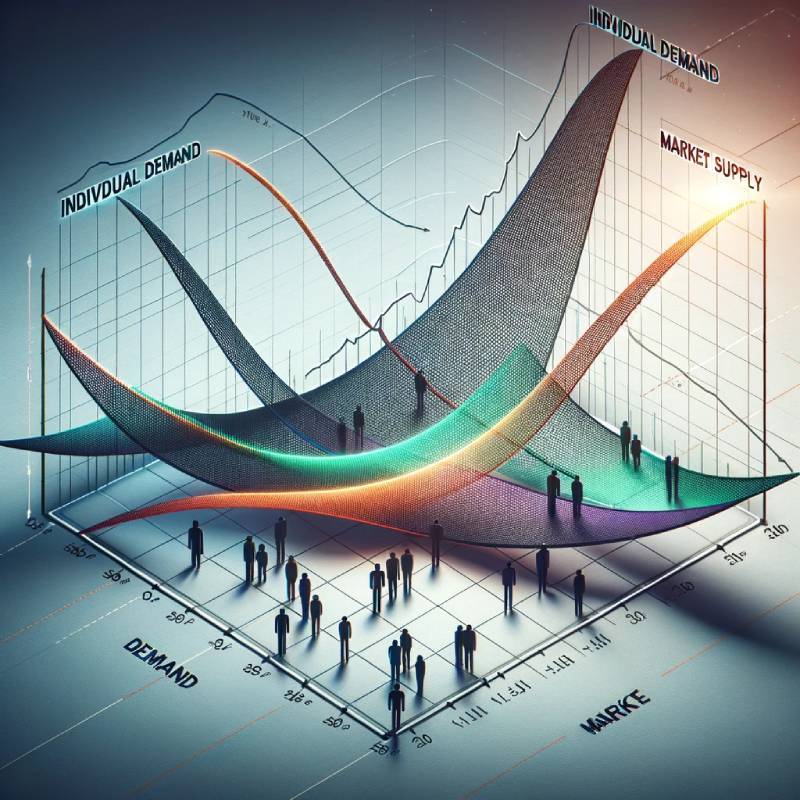
- Individual Demand Curve: This represents the relationship between the price of a good or service and the quantity of that good or service that a single consumer is willing and able to purchase at each price point. It is typically downward sloping, indicating that as the price decreases, the quantity demanded by the individual increases, and vice versa.
- Individual Supply Curve: This shows the relationship between the price of a good or service and the quantity of that good or service that a single supplier is willing and able to offer for sale at each price point. Generally, it has an upward slope, meaning that as the price increases, the individual supplier is willing to offer more for sale, and as the price decreases, they are willing to offer less.
Market Demand or Supply Curve
- Market Demand Curve: The market demand curve is the horizontal summation of all individual demand curves for a good or service. It represents the total quantity of a good or service that all consumers in a market are willing and able to purchase at each price level. Like the individual demand curve, it is typically downward sloping.
- Market Supply Curve: This is the horizontal summation of all individual supply curves for a good or service. It illustrates the total quantity of a good or service that all suppliers in a market are willing and able to sell at each price level. The market supply curve usually slopes upward, similar to the individual supply curve.
Relationship Between Individual and Market Curves
- Aggregation: The key relationship is one of aggregation. Market demand and supply curves are essentially the sum of all individual demand and supply curves in a given market. Each point on the market curve reflects the combined willingness to buy or sell at various price points among all participants in the market.
- Influence of Individual Changes: Changes in individual demand or supply can impact the market curve. For instance, if many individuals increase their demand for a product (perhaps due to a change in tastes or a rise in income), the market demand curve will shift to the right, indicating a higher quantity demanded at each price level.
- Market Equilibrium: The interaction of the market demand and supply curves determines the market equilibrium, where the quantity demanded equals the quantity supplied. Individual curves contribute to this equilibrium but do not singularly determine it.
- Sensitivity and Responsiveness: The responsiveness of the market curves to changes in individual curves can vary. For instance, in a large market, the change in demand or supply by a single individual may have a negligible effect on the market curve. However, in smaller markets or for niche products, individual actions can have a more significant impact.
Understanding this relationship is crucial in economics as it helps in analyzing how changes in personal preferences, incomes, production costs, and other factors affect the broader market.

