")
The market for loanable funds is a conceptual economic framework used to analyze the interaction between borrowers and lenders, determining the market interest rate and the quantity of loanable funds. It operates in the broader context of the financial system, where savers supply funds by deferring consumption, making their savings available for investment, and borrowers demand these funds for investment projects, consumption, or government spending.
### Key Components:
– **Supply of Loanable Funds:** The supply in this market comes primarily from households’ savings, but it also includes funds from businesses retaining earnings (not distributed as dividends) and government surpluses (when government revenues exceed expenditures). The supply curve typically slopes upwards, indicating that as the interest rate rises, saving becomes more attractive, leading to an increase in the quantity of loanable funds supplied.
– **Demand for Loanable Funds:** Demand is driven by borrowers, which include businesses seeking to invest in new projects, consumers financing purchases like homes and cars, and governments financing deficits. The demand curve generally slopes downwards, suggesting that lower interest rates make borrowing more appealing, increasing the quantity of loanable funds demanded.
– **Interest Rate:** The price of borrowing in the market for loanable funds. It serves as the mechanism that equilibrates the supply and demand for funds. A higher interest rate discourages borrowing and encourages saving, reducing the quantity of loanable funds demanded and increasing the quantity supplied, respectively. Conversely, a lower interest rate stimulates borrowing and discourages saving, leading to an opposite effect.
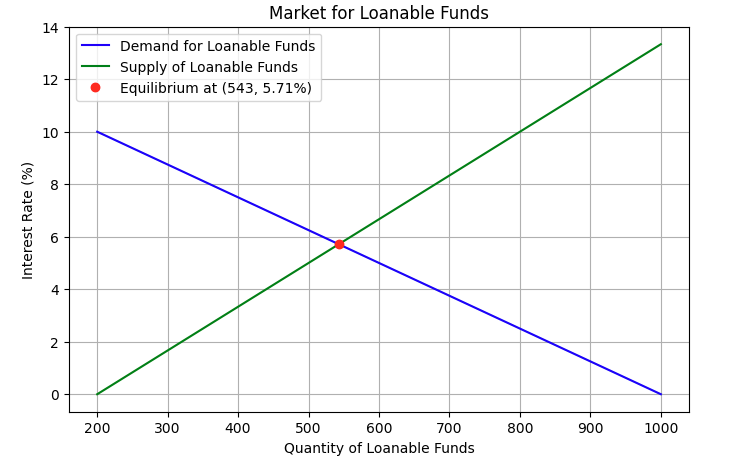
– **Equilibrium:** The market reaches equilibrium where the supply of loanable funds equals the demand. At this point, the equilibrium interest rate is established, and the volume of saving equals the volume of investment.
### Importance and Impact:
This market plays a crucial role in determining the allocation of resources in an economy, influencing economic growth. Investments funded through this market can lead to the accumulation of capital stock, technological advancements, and improvements in productivity. Changes in government policy, such as tax incentives for saving or spending, can shift the supply and demand curves, affecting the equilibrium interest rate and the quantity of funds available for investment.
The market for loanable funds illustrates how financial markets integrate savers and borrowers, facilitating the flow of capital and influencing overall economic activity through the determination of interest rates.
The chart should roughly look like this:
import matplotlib.pyplot as plt
import numpy as np

# Define the range for the quantity of loanable funds
quantity_funds = np.linspace(200, 1000, 400)

# Calculate the interest rates for demand and supply based on the quantity
interest_rate_demand = (1000 - quantity_funds) / 80
interest_rate_supply = (quantity_funds - 200) / 60

# Calculate the equilibrium point
eq_quantity = (1000*60 + 200*80) / (80 + 60)
eq_interest_rate = (eq_quantity - 200) / 60

# Create the plot
fig, ax = plt.subplots(figsize=(8, 5))
ax.plot(quantity_funds, interest_rate_demand, label='Demand for Loanable Funds', color='blue')
ax.plot(quantity_funds, interest_rate_supply, label='Supply of Loanable Funds', color='green')
ax.plot(eq_quantity, eq_interest_rate, 'ro', label=f'Equilibrium at ({eq_quantity:.0f}, {eq_interest_rate:.2f}%)')

# Add titles and labels
ax.set_title('Market for Loanable Funds')
ax.set_xlabel('Quantity of Loanable Funds')
ax.set_ylabel('Interest Rate (%)')
ax.legend()

# Add grid
ax.grid(True)

# Show the plot
plt.show()