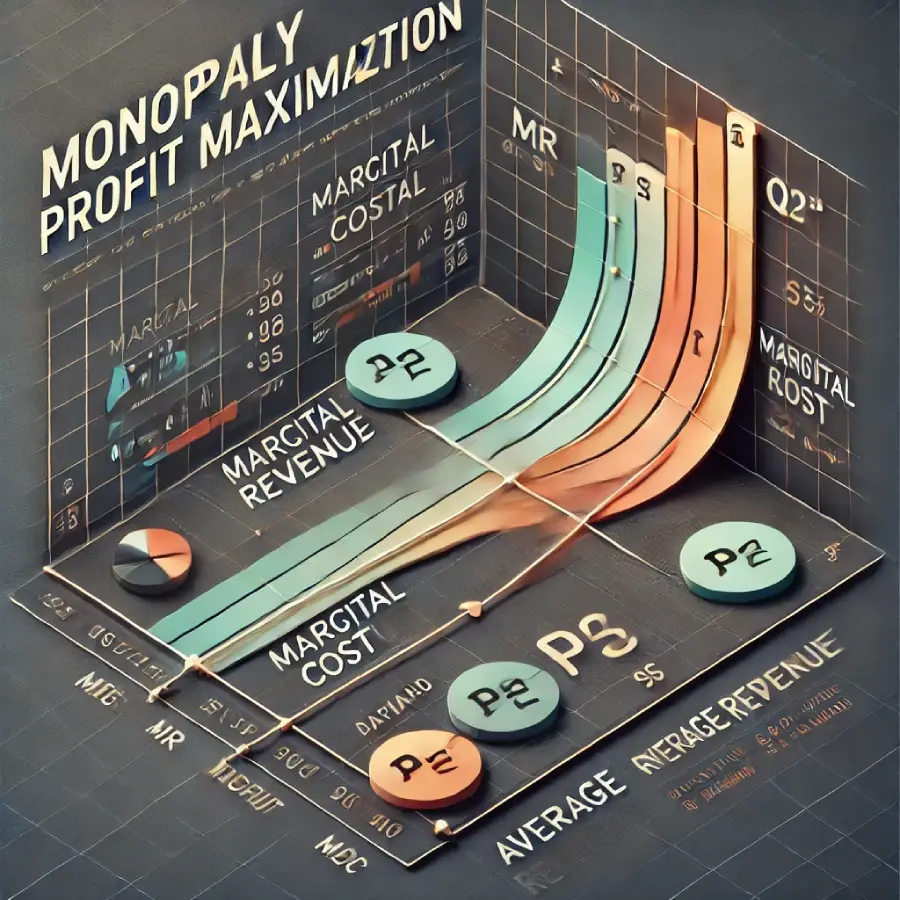
In economics, understanding how a monopolist maximizes profit provides critical insights into market dynamics and pricing strategies. A monopolist is a single seller in a market with no close substitutes for its product. As such, it has significant control over prices and output levels. This article explores the concept of monopoly profit maximization, focusing on the relationship between revenue, cost, and profit, and the methods to determine optimal pricing and output levels.
Key Concepts in Monopoly Economics
- Total Revenue (TR): The total income a firm earns from selling its product, calculated as:
where is the price per unit, and is the quantity sold.
- Marginal Revenue (MR): The additional revenue earned by selling one more unit of output. For a linear demand curve, the MR curve has the same intercept as the demand (or average revenue) curve but a steeper slope:
- Total Cost (TC): The sum of all costs incurred in producing a given quantity of goods. It includes fixed costs (independent of output) and variable costs (dependent on output):
- Marginal Cost (MC): The additional cost of producing one more unit of output:
- Profit (): The difference between total revenue and total cost:
The Profit-Maximizing Rule
To maximize profit, a monopolist produces at the output level where marginal revenue equals marginal cost (MR = MC). This principle ensures that the additional revenue from producing one more unit is exactly equal to the additional cost, avoiding overproduction or underproduction.
- Mathematical Approach: Profit maximization involves finding the output level () where:
The first derivative of the profit function with respect to is set to zero:
- Graphical Representation:
- The profit-maximizing output is the point where the MR curve intersects the MC curve.
- At this output, the price () is determined from the demand curve, reflecting consumers’ willingness to pay for .
- Verbal Explanation: A monopolist will continue producing as long as the additional revenue from selling one more unit exceeds the additional cost. When these values are equal, profit is maximized.
Example: Agricultural Chemical Firm
Suppose a monopolist faces a linear demand curve represented by:
and the cost per unit is constant at $10. Total cost () and revenue () can be expressed as:
- Marginal Revenue:
- Marginal Cost:
Setting :
The price is derived from the demand curve:
Profit can be calculated as:
Insights and Implications
- Revenue vs. Cost Trade-offs: A monopolist must balance the benefits of higher revenue against the costs of producing additional units.
- Market Power: The ability to set prices above marginal cost leads to higher profits but can result in consumer surplus loss and allocative inefficiency.
- Policy Implications: Understanding monopoly behavior informs antitrust regulations and interventions to prevent market abuse.
Monopoly profit maximization demonstrates the interplay of revenues and costs in determining output and pricing strategies. By employing mathematical, graphical, and verbal tools, economists can better understand and predict monopolistic behavior, aiding both businesses and policymakers in navigating market structures.

