Mathematics in Economics: An Academic Overview of Real-Valued Functions and Applications
Abstract
This article presents a comprehensive overview of foundational concepts in mathematics as applied to economics, based on university-level material. Emphasis is placed on real-valued functions, their properties, and their graphical and analytical interpretation. Real-world applications such as cost, revenue, supply and demand functions are discussed with mathematical rigor. The aim is to bridge theoretical knowledge with practical economic modeling, while ensuring originality and adherence to academic integrity.
1. Introduction
Mathematics serves as a core language of economics. From analyzing consumer behavior to optimizing production and pricing strategies, economic models rely heavily on functions, algebra, and calculus. This article explores the theoretical structure and practical application of real-valued functions within economics, laying the groundwork for deeper study in optimization and modeling.
2. Real-Valued Functions and Economic Interpretation
A function maps every element (domain) to a real number . In economics, common examples include:
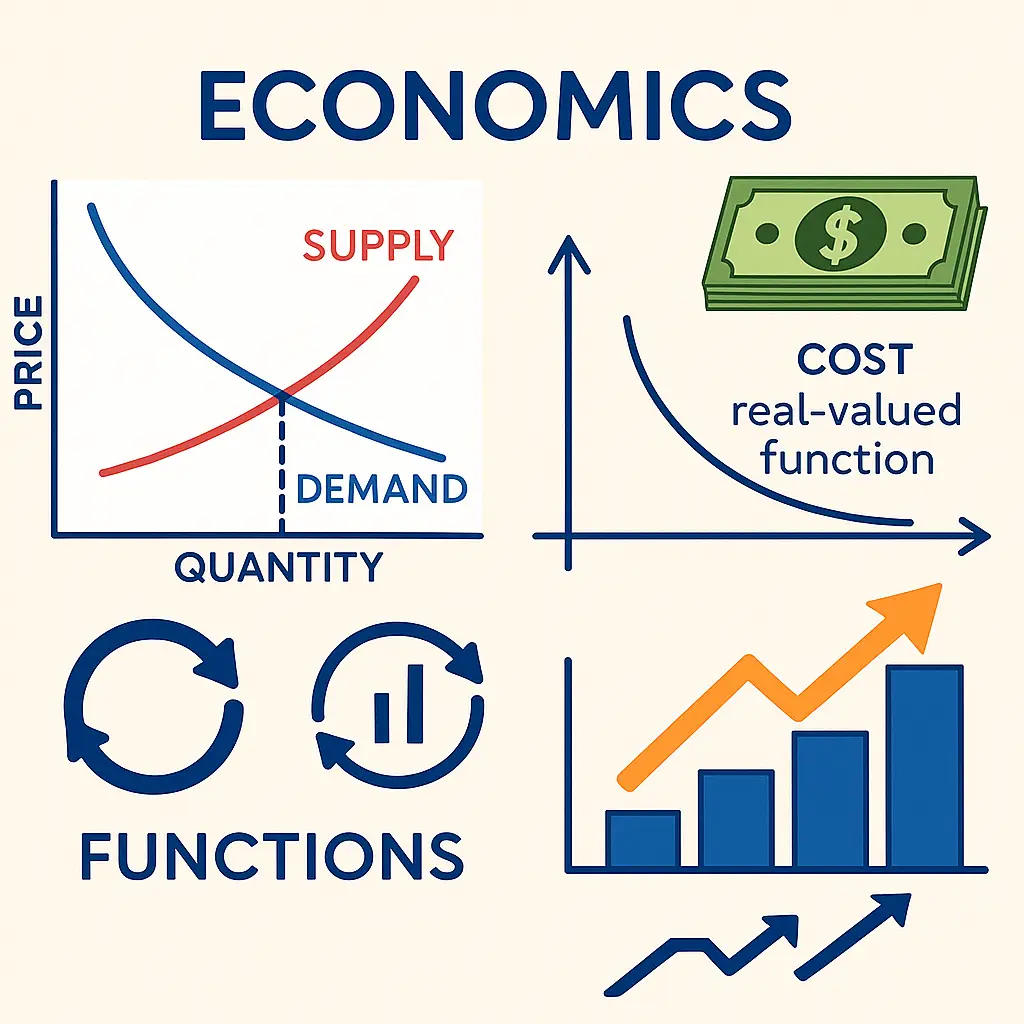
- Demand function: — quantity demanded at price
- Supply function: — quantity supplied at price
- Cost function: — total cost of producing units
Key concepts include:
- Domain and codomain
- Graphical representation
- Monotonicity (increasing/decreasing)
- Linearity and nonlinearity
3. Operations with Functions
Economists often combine functions through operations:
- Addition: represents total cost and tax
- Multiplication: used in revenue = price quantity
- Composition: , e.g., total cost as a function of price via demand
Understanding domains is critical to applying these correctly in real-world contexts.
4. Graphs and Intersections
Functions are visually analyzed using Cartesian graphs. Important interpretations include:
- Intersections: often represents equilibrium (e.g., supply = demand)
- Axes intercepts: Indicate zero output, breakeven points
- Slopes: Measure marginal changes (e.g., marginal cost)
Graphing aids in interpreting comparative statics and predicting behavior under parameter changes.
5. Special Functions in Economics
- Linear functions: , used in simple cost or revenue models
- Quadratic functions: , common in profit maximization
- Power and exponential functions: used in growth models and elasticity
Each function type reflects a different economic structure (constant returns, diminishing returns, etc.).
6. Applications
Example 1: Break-even Analysis
Given cost and revenue , profit is: Break-even:
Example 2: Market Equilibrium
Set
These examples illustrate how algebraic tools directly support economic analysis.
7. Limits and Continuity
Limits describe economic behavior as variables approach certain values:
- : value function tends toward
- Discontinuities represent jumps or thresholds (e.g., tax brackets)
Understanding continuity is essential in microeconomics (e.g., utility functions) and calculus-based modeling.
8. Conclusion
This article has presented an original synthesis of mathematical tools used in economic modeling. From foundational function theory to real applications like profit and equilibrium, the structured mathematical approach empowers economists to make data-driven and logically sound decisions. The goal is to not only understand but also use these concepts to construct robust, efficient, and ethical economic models.
References
- Chiang, A. C., & Wainwright, K. (2005). Fundamental Methods of Mathematical Economics.
- Sydsaeter, K., Hammond, P. (2012). Essential Mathematics for Economic Analysis.

