Introduction
In microeconomics, consumer surplus and producer surplus are fundamental concepts for understanding market efficiency, welfare, and the benefits of trade. These surpluses represent the differences between what buyers and sellers are willing to pay or accept and the actual market price. This blog post explains these concepts clearly and shows how calculus, particularly integrals, is used to quantify them.
1. Consumer Surplus: Definition and Interpretation
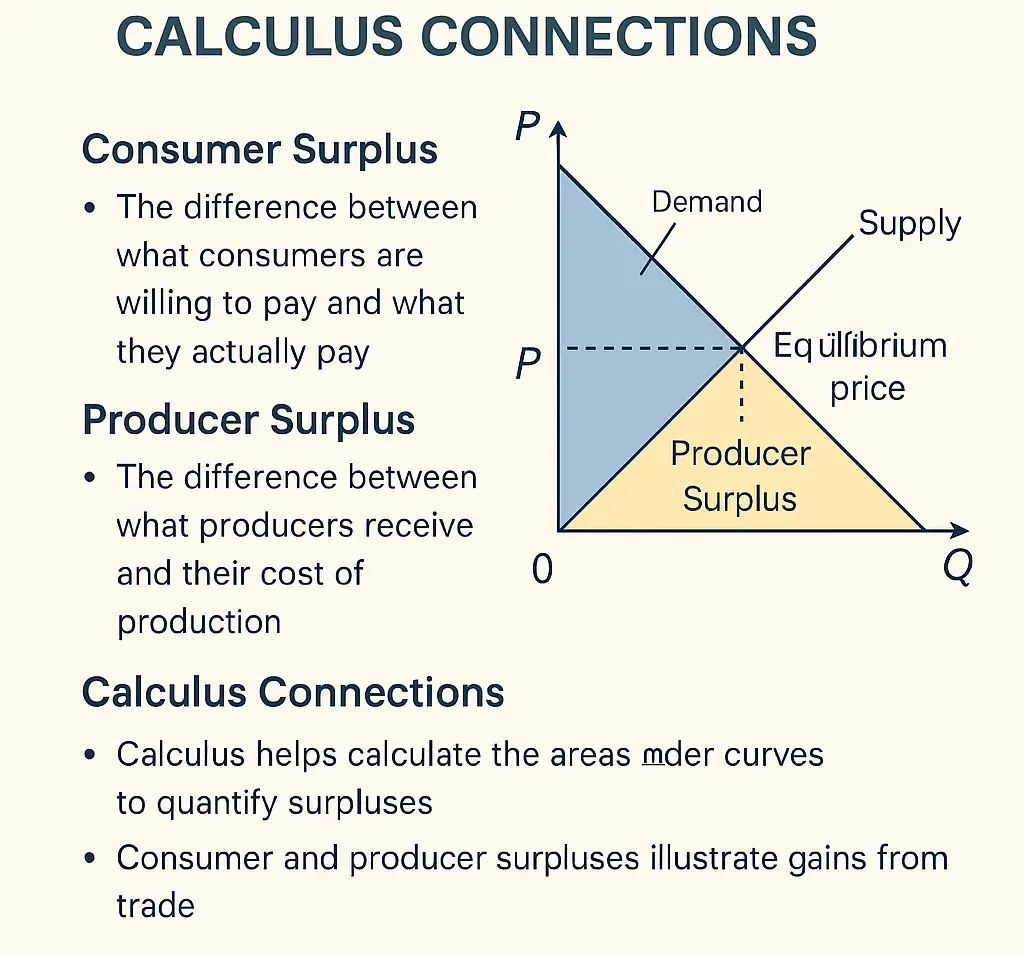
Consumer surplus (CS) is the difference between what consumers are willing to pay for a good or service and what they actually pay.
Formula:
where:
- : demand function
- : market price
- : equilibrium quantity
Graphical Representation:
- It is the area between the demand curve and the price line (above the price).
- In a linear demand model, it forms a triangle.
Example:
If and , find CS at equilibrium :
2. Producer Surplus: Definition and Interpretation
Producer surplus (PS) is the difference between the price sellers receive and the minimum price they are willing to accept.
Formula:
where:
- : supply function
Graphical Representation:
- It is the area between the price line and the supply curve (below the price).
- Also often forms a triangle in linear models.
Example:
If , , :
3. Significance of Surpluses
- Consumer surplus measures consumer welfare and willingness to pay.
- Producer surplus reflects producer welfare and profitability.
- Combined, they indicate total economic surplus or social welfare.
Market Efficiency:
- A perfectly competitive market maximizes total surplus.
- Taxes, subsidies, or price controls alter the surpluses and can cause deadweight losses.
4. Calculus Connection
- Integration captures the area under curves, essential for calculating surpluses accurately.
- Linear models yield simple triangle areas, but nonlinear functions require definite integrals.
5. Summary Table
| Concept | Formula | Meaning |
|---|---|---|
| Consumer Surplus | Benefit consumers get above price | |
| Producer Surplus | Benefit producers get above cost | |
| Economic Surplus | CS + PS | Total gains from trade |
Conclusion
Consumer and producer surplus are essential tools for evaluating market performance and understanding welfare impacts. Calculus makes their computation precise, especially when dealing with real-world, nonlinear demand and supply functions. Mastering these concepts equips economists and students with tools to assess policies, market interventions, and economic well-being.
Further Reading
- Varian, H. R. Intermediate Microeconomics
- Chiang & Wainwright, Fundamental Methods of Mathematical Economics

