Introduction
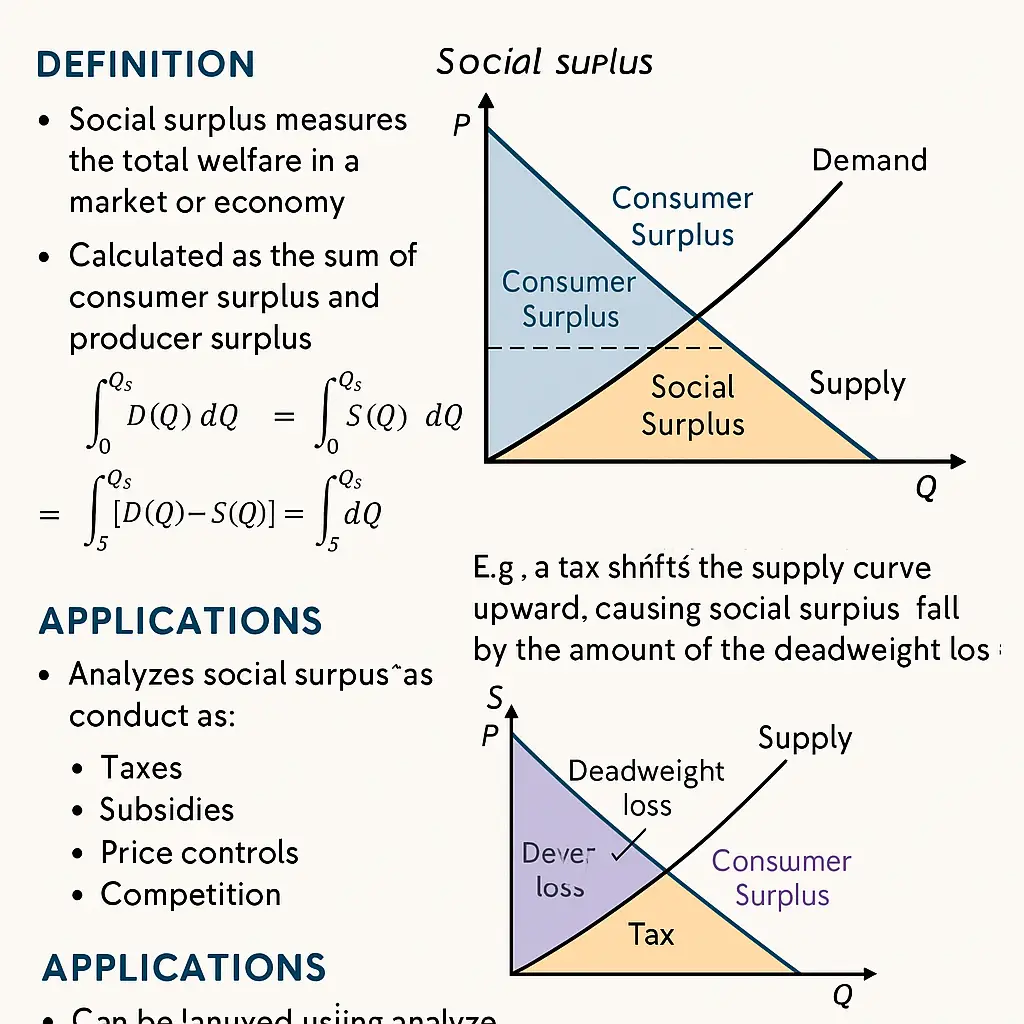
In microeconomic theory, the concept of social surplus represents the total welfare generated in a market. It is the sum of consumer surplus (CS) and producer surplus (PS). Social surplus serves as a core benchmark for evaluating the efficiency of market outcomes and the effects of economic policies such as taxes, subsidies, price controls, and quotas.
This blog post introduces the concept of social surplus, how it’s calculated, and how it helps economists measure the overall effectiveness of market structures and public interventions.
1. What Is Social Surplus?
- Consumer Surplus (CS): The benefit consumers receive by paying less than what they are willing to pay.
- Producer Surplus (PS): The benefit producers receive by selling at a market price higher than their minimum acceptable price (usually the marginal cost).
2. Graphical Interpretation
In a supply-and-demand graph:
- Social surplus is the area between the demand curve and the supply curve, from 0 to the equilibrium quantity .
It forms a large triangle:
- The top vertex is on the demand curve (maximum willingness to pay)
- The bottom vertex is on the supply curve (minimum cost to produce)
- The base lies along the equilibrium quantity axis
3. Calculating Social Surplus Using Integrals
Let be the inverse demand function and the inverse supply function. Then:
This definite integral measures the net benefit to society from the voluntary exchange of units.
4. Example: Linear Demand and Supply
Let:
- Equilibrium:
So, social surplus equals €1066.80 at the competitive equilibrium.
5. Social Surplus as a Benchmark of Efficiency
- Perfect competition maximizes social surplus.
- Taxes and subsidies reallocate surplus but often reduce total surplus due to deadweight loss.
- Monopolies restrict output, reducing consumer surplus and total social welfare.
Efficiency Criterion:
An outcome is Pareto efficient if no one can be made better off without making someone worse off. Maximizing social surplus aligns with Pareto optimality in competitive markets.
6. Policy Applications
| Policy Tool | Effect on CS | Effect on PS | Effect on SS |
|---|---|---|---|
| Price ceiling | Decreases | May increase or decrease | Reduces (DWL) |
| Tax | Decreases | Decreases | Reduces (creates DWL) |
| Subsidy | Increases CS | Increases PS | Increases cost to govt |
| Monopoly pricing | Decreases CS | Increases PS (short-term) | Reduces SS |
Conclusion
Social surplus is the foundation for evaluating the overall well-being created by market activity. It unifies the perspectives of buyers and sellers into a single framework and provides a measurable criterion for judging market outcomes and policy efficiency. Through calculus, particularly definite integration, economists can compute surplus precisely and analyze welfare effects in nuanced, evidence-based ways.
Further Reading
- Varian, H. R. Intermediate Microeconomics
- Pindyck & Rubinfeld, Microeconomics

