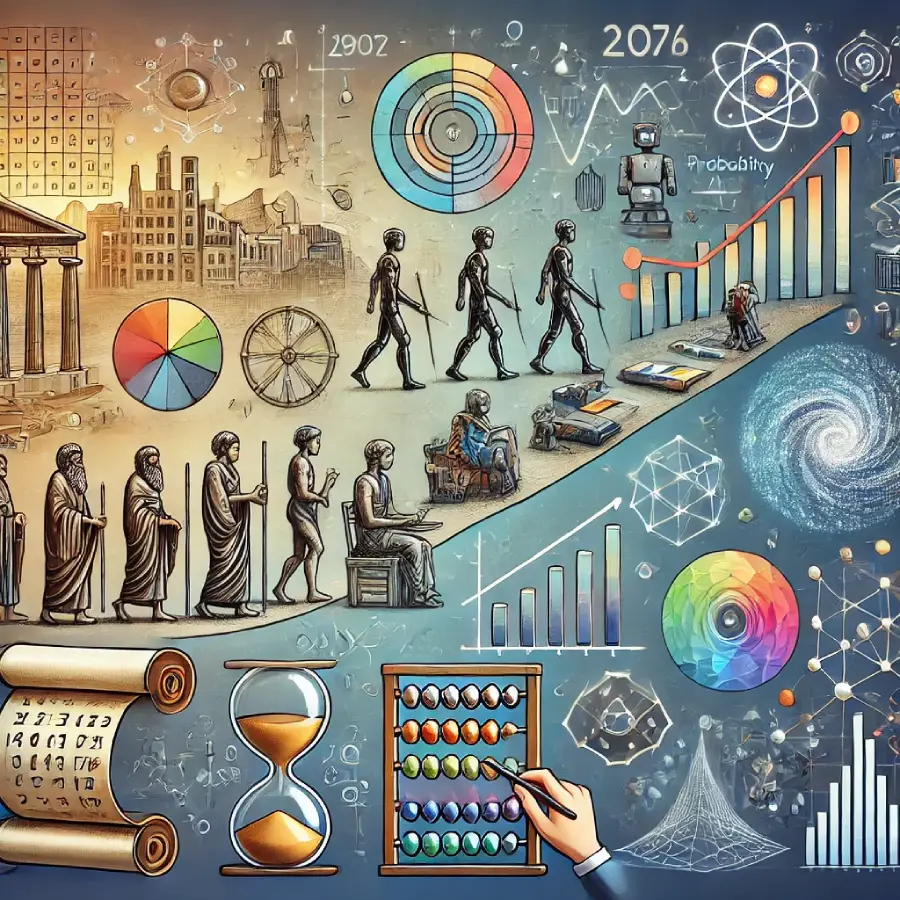
In the age of big data and artificial intelligence, statistics has emerged as a cornerstone of modern data analysis. From its historical roots in census-taking and probability theory to its present-day applications in machine learning and predictive modeling, statistics continues to evolve, offering indispensable tools for decision-making in an increasingly complex world.
A Brief Historical Perspective
Statistics, derived from the Latin word “status” (state), initially served governmental needs for population counts and resource management. Over centuries, it transformed into a robust scientific discipline, thanks to pioneers like Pascal and Laplace, who linked it to probability theory. Today, this evolution is evident in advanced algorithms that power recommendations on streaming platforms, optimize logistics in e-commerce, and predict disease outbreaks.
Why Statistics Matters in Data Analysis
At its core, statistics provides the foundation for data interpretation. It ensures that raw data becomes actionable insights by applying rigorous methods for collection, organization, and analysis. Here’s how statistics contributes to modern data analysis:
- Descriptive Analytics: Statistical measures like mean, median, and standard deviation summarize data to provide a clear overview of trends and patterns.
- Inferential Analytics: Techniques like hypothesis testing and regression analysis allow analysts to make predictions and infer properties about populations based on samples.
- Data Validation: Statistical methods ensure the accuracy and reliability of data, filtering out biases and anomalies.
Connecting Statistics to Modern Trends
Incorporating traditional statistical methods into trendy technologies amplifies their utility and appeal. Here are a few key areas where statistics shines in modern contexts:
- Machine Learning: Algorithms rely heavily on statistical principles. For example, linear regression and decision trees are statistical models at heart. Understanding statistics enhances model accuracy and interpretability.
- Data Visualization: Statistical charts and graphs, such as histograms and scatter plots, are integral to conveying complex data insights effectively.
- Predictive Analytics: Businesses leverage statistical models to forecast customer behavior, market trends, and financial risks, enabling proactive decision-making.
- Big Data: With data sets growing exponentially, statistical sampling and summarization techniques are crucial for extracting meaningful insights from vast, unstructured data.
Practical Applications for Blog Readers
To bridge the gap between theory and practice, here are actionable ways readers can apply statistical concepts:
- Start Small: Use tools like Excel or Python libraries (e.g., Pandas, NumPy) to calculate basic statistical measures.
- Explore Data Sets: Websites like Kaggle offer datasets that beginners can analyze to hone their statistical skills.
- Learn Visualization: Tools like Tableau and Power BI help create compelling visual narratives rooted in statistical insights.
Final Thoughts
Statistics is no longer just about numbers and charts; it’s the language of data-driven decision-making. Whether you’re analyzing trends for a business strategy or building the next big AI algorithm, a solid foundation in statistics ensures your insights are both accurate and impactful.
As the demand for data analysis continues to rise, incorporating statistical knowledge into your toolkit can set you apart in this competitive landscape. So why not start today? Whether you’re a student, professional, or hobbyist, the power of statistics is waiting for you to harness it.

