Introduction
The Normal Distribution, also known as the Gaussian distribution, is one of the most important and widely used probability distributions in statistics. It plays a central role in many natural, social, and technical processes, modeling everything from human heights and exam scores to measurement errors and financial returns. The characteristic bell curve of the normal distribution makes it easily recognizable, and its mathematical properties are key to many statistical methods, including hypothesis testing and regression analysis.
—
The Normal Distribution: Definition and Properties
1. Definition
A random variable \( X \) is said to follow a normal distribution if its probability density function (PDF) is given by:
\[
f(x) = \frac{1}{\sigma \sqrt{2\pi}} e^{-\frac{(x – \mu)^2}{2\sigma^2}}
\]
Here:
– \( \mu \) is the mean, representing the center of the distribution.
– \( \sigma \) is the standard deviation, which measures the spread or dispersion of the data.
– \( \sigma^2 \) is the variance, which describes how much the data varies from the mean.
2. Key Properties
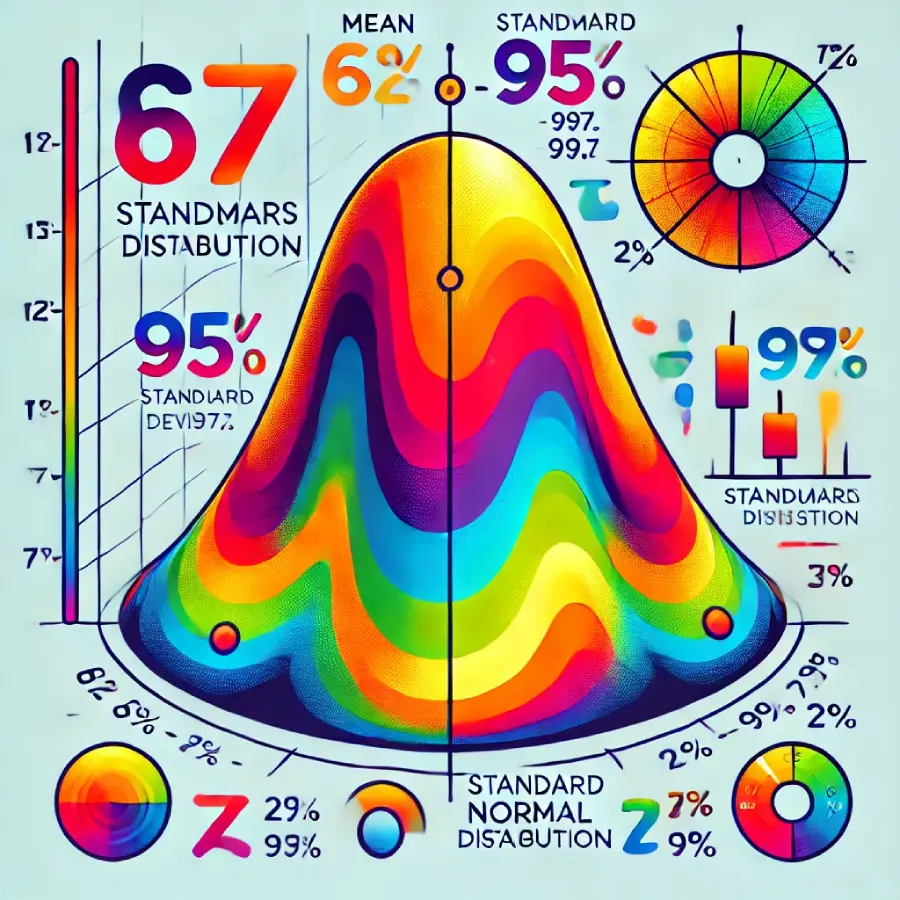
– Symmetry: The normal distribution is symmetric around the mean \( \mu \). The left and right halves of the distribution are mirror images.
– Bell-shaped curve: The normal distribution is characterized by its smooth, bell-shaped curve. The height of the curve decreases as you move away from the mean.
– 68-95-99.7 Rule (Empirical Rule): In a normal distribution:
– About 68% of the data lies within 1 standard deviation of the mean (\( \mu \pm \sigma \)).
– About 95% of the data lies within 2 standard deviations of the mean (\( \mu \pm 2\sigma \)).
– About 99.7% of the data lies within 3 standard deviations of the mean (\( \mu \pm 3\sigma \)).
– Unimodal: The normal distribution has a single peak at the mean \( \mu \), meaning it has only one mode.
3. Standard Normal Distribution
A standard normal distribution is a special case of the normal distribution where the mean \( \mu = 0 \) and the standard deviation \( \sigma = 1 \). The PDF of the standard normal distribution is:
\[
f(z) = \frac{1}{\sqrt{2\pi}} e^{-\frac{z^2}{2}}
\]
The random variable \( Z \), which follows a standard normal distribution, is often used in statistical analysis. Any normal distribution can be transformed into the standard normal distribution using the z-score:
\[
Z = \frac{X – \mu}{\sigma}
\]
The z-score represents the number of standard deviations a data point \( X \) is from the mean.
—
Applications of the Normal Distribution
The normal distribution appears in various real-world contexts, largely because of the Central Limit Theorem (CLT). The CLT states that the sum (or average) of a large number of independent and identically distributed random variables tends to follow a normal distribution, regardless of the original distribution of the variables. This is why normal distribution is so common in practice.
1. Natural Phenomena
Many naturally occurring phenomena, such as human heights, weights, and IQ scores, approximately follow a normal distribution. For example, most people are of average height, with fewer people being very tall or very short. The spread of heights forms a bell-shaped curve when plotted on a graph.
2. Measurement Errors
In experimental sciences, measurement errors often follow a normal distribution. When repeated measurements of the same quantity are taken, the errors tend to be randomly distributed around the true value, with smaller errors being more likely than larger ones.
3. Finance and Economics
In finance, the normal distribution is frequently used to model the returns of assets such as stocks or bonds. Under the assumption that returns follow a normal distribution, analysts can estimate the probability of extreme losses or gains, and apply risk management strategies.
4. Statistical Inference
Many statistical methods, including t-tests, regression analysis, and confidence interval estimation, are based on the assumption that the underlying data follows a normal distribution. The normal distribution also underpins many machine learning algorithms, making it a cornerstone of modern data science.
—
Skewness and Kurtosis
While the normal distribution is symmetric, real-world data can sometimes exhibit asymmetry (skewness) or heavier or lighter tails than the normal distribution (kurtosis).
– Skewness: A measure of the asymmetry of the distribution. A normal distribution has a skewness of 0.
– Right-skewed (positive skew): The tail on the right-hand side of the distribution is longer or fatter than the left-hand side.
– Left-skewed (negative skew): The tail on the left-hand side is longer or fatter than the right-hand side.
– Kurtosis: A measure of the “tailedness” of the distribution. A normal distribution has a kurtosis of 3 (mesokurtic).
– Leptokurtic: Distributions with kurtosis greater than 3, indicating fatter tails and a higher peak.
– Platykurtic: Distributions with kurtosis less than 3, indicating thinner tails and a lower peak.
—
Limitations of the Normal Distribution
Although the normal distribution is a powerful tool, it has some limitations in modeling real-world phenomena:
– Not All Data is Normal: Many datasets exhibit skewness or kurtosis, which the normal distribution cannot capture.
– Bounded Data: The normal distribution assumes that values can extend infinitely in both directions. This assumption may not hold for data that has natural boundaries (e.g., percentages, which must lie between 0 and 100).
– Extreme Events: The normal distribution underestimates the probability of extreme events (often referred to as “fat tails”). For example, stock market crashes occur more frequently than predicted by a normal distribution.
—
Conclusion
The normal distribution is one of the most important and widely used distributions in statistics, thanks to its simple mathematical form and applicability to many natural processes. Its key properties—symmetry, unimodality, and the 68-95-99.7 rule—make it a powerful tool for modeling uncertainty and variability in numerous fields, from finance to physics. Despite its limitations, the normal distribution remains a foundational concept in probability theory and is indispensable for statistical inference and decision-making.
Understanding the normal distribution, how to apply it, and when to use alternative distributions is essential for anyone working with data and probability.

